COVID-19 Vaccines & Treatment A collection of resources concerning COVID-19 vaccines and treatment, including hospitalization, death records, etc.
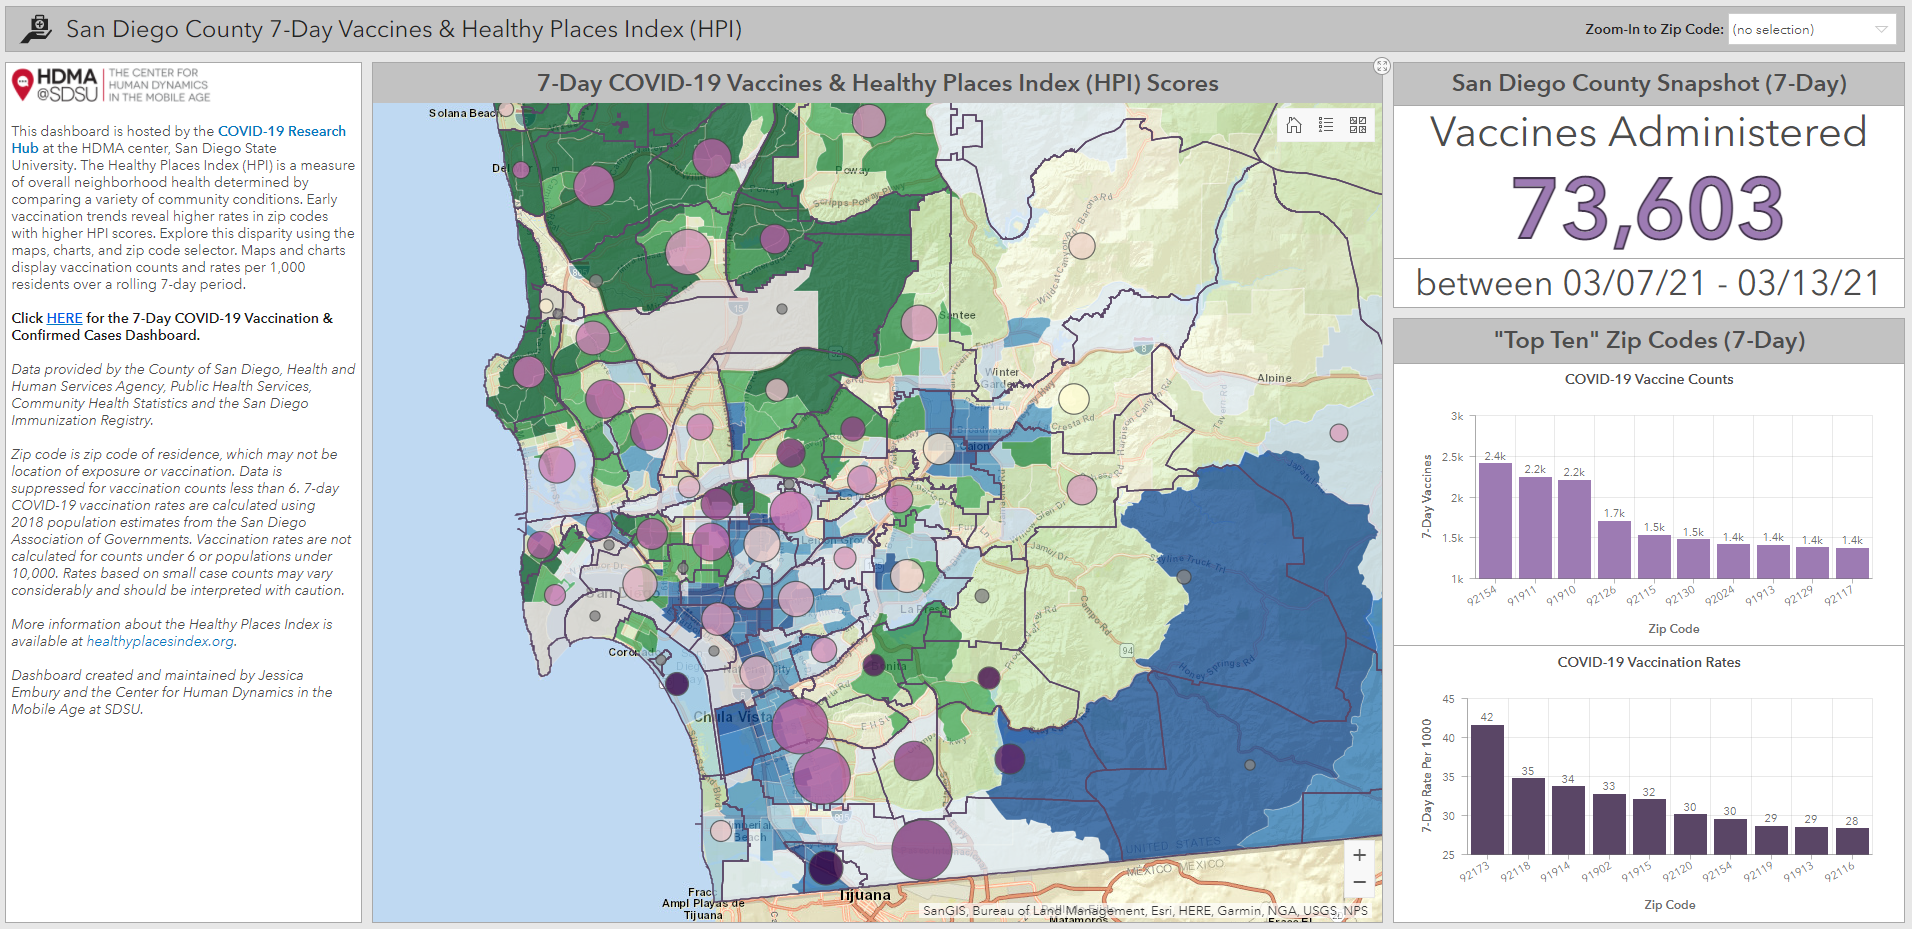
7-Day Change in COVID-19 Vaccinated Residents & Healthy Places Index (HPI)
This mobile-friendly dashboard created by the HDMA Center compares the 7-day change in vaccinated residents (1+ dose) and rates to Healthy Places Index (HPI) scores. The Healthy Places Index is a measure of overall neighborhood health determined by comparing a variety of community conditions. Early trends reveal higher vaccination rates in zip codes with higher HPI scores. Explore this disparity using the dashboard's map and "top ten" charts.
The Dashboard can be accessed here:
7-Day Vaccinated Residents & HPI Scores →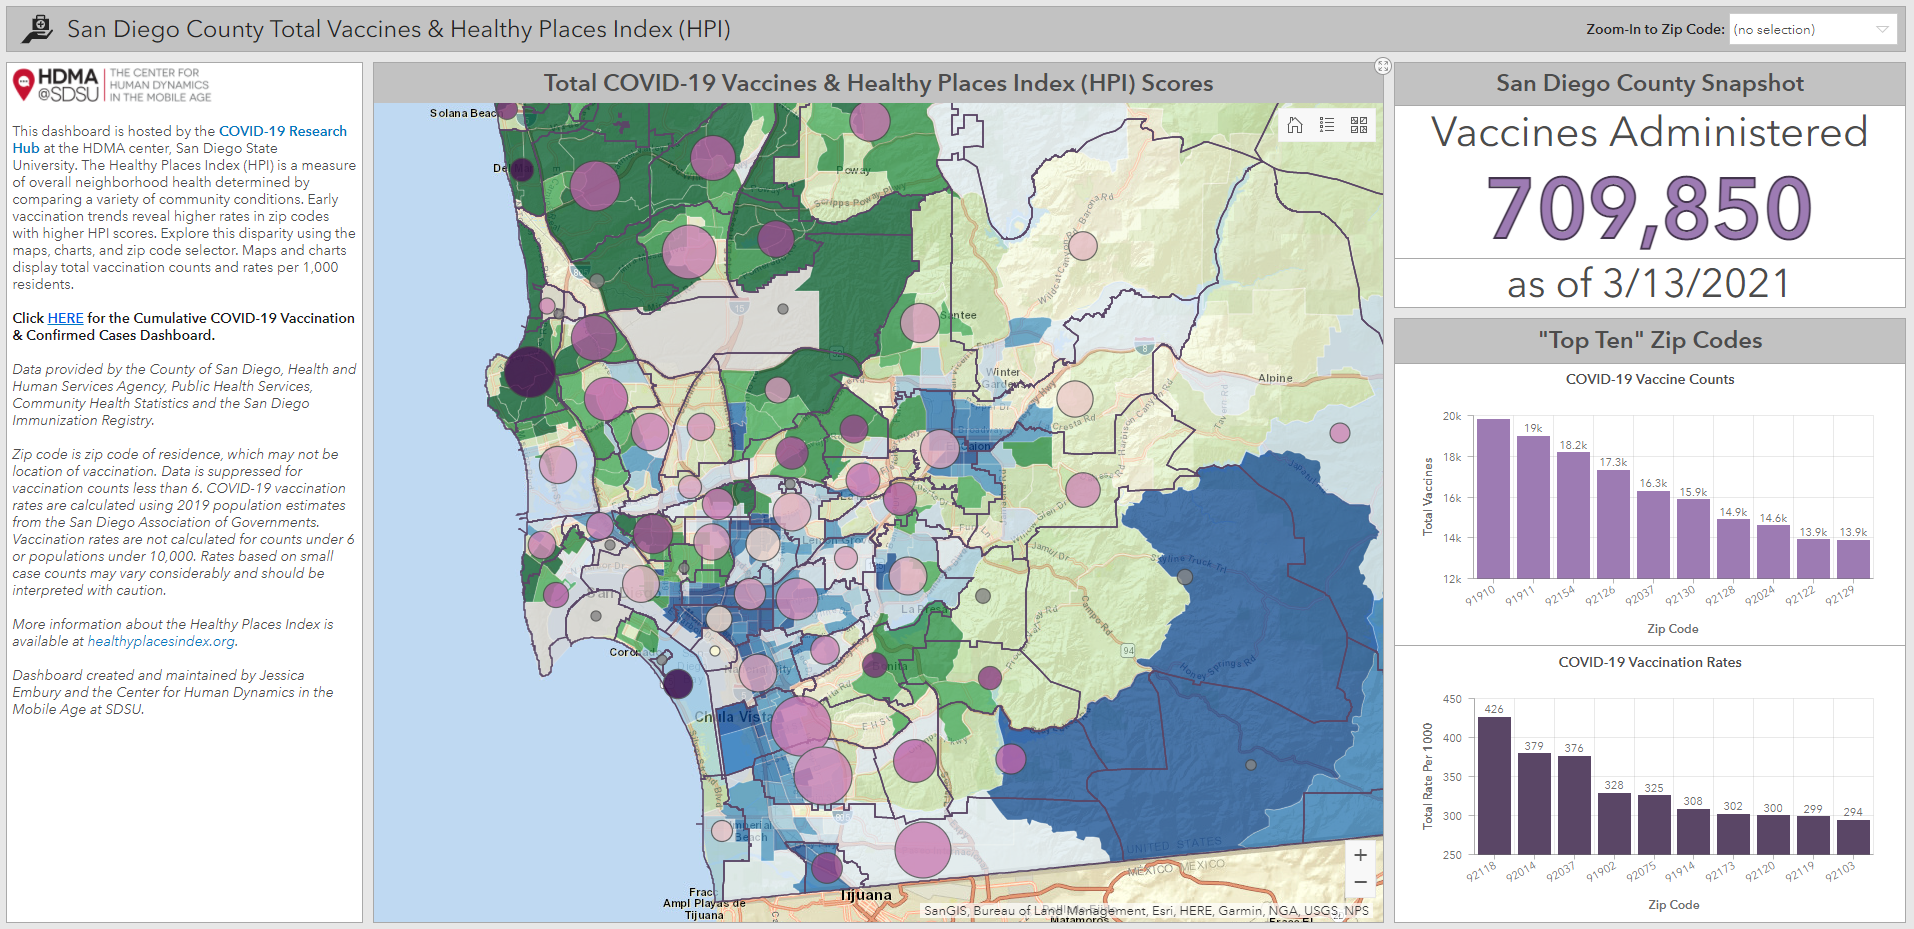
Total COVID-19 Vaccinated Residents & Healthy Places Index (HPI)
This mobile-friendly dashboard created by the HDMA Center compares total vaccinated residents (1+ dose) and rates to Healthy Places Index (HPI) scores. The Healthy Places Index is a measure of overall neighborhood health determined by comparing a variety of community conditions. Early trends reveal higher vaccination rates in zip codes with higher HPI scores. Explore this disparity using the dashboard's map and "top ten" charts.
The Dashboard can be accessed here:
Total Vaccinated Residents & HPI Scores →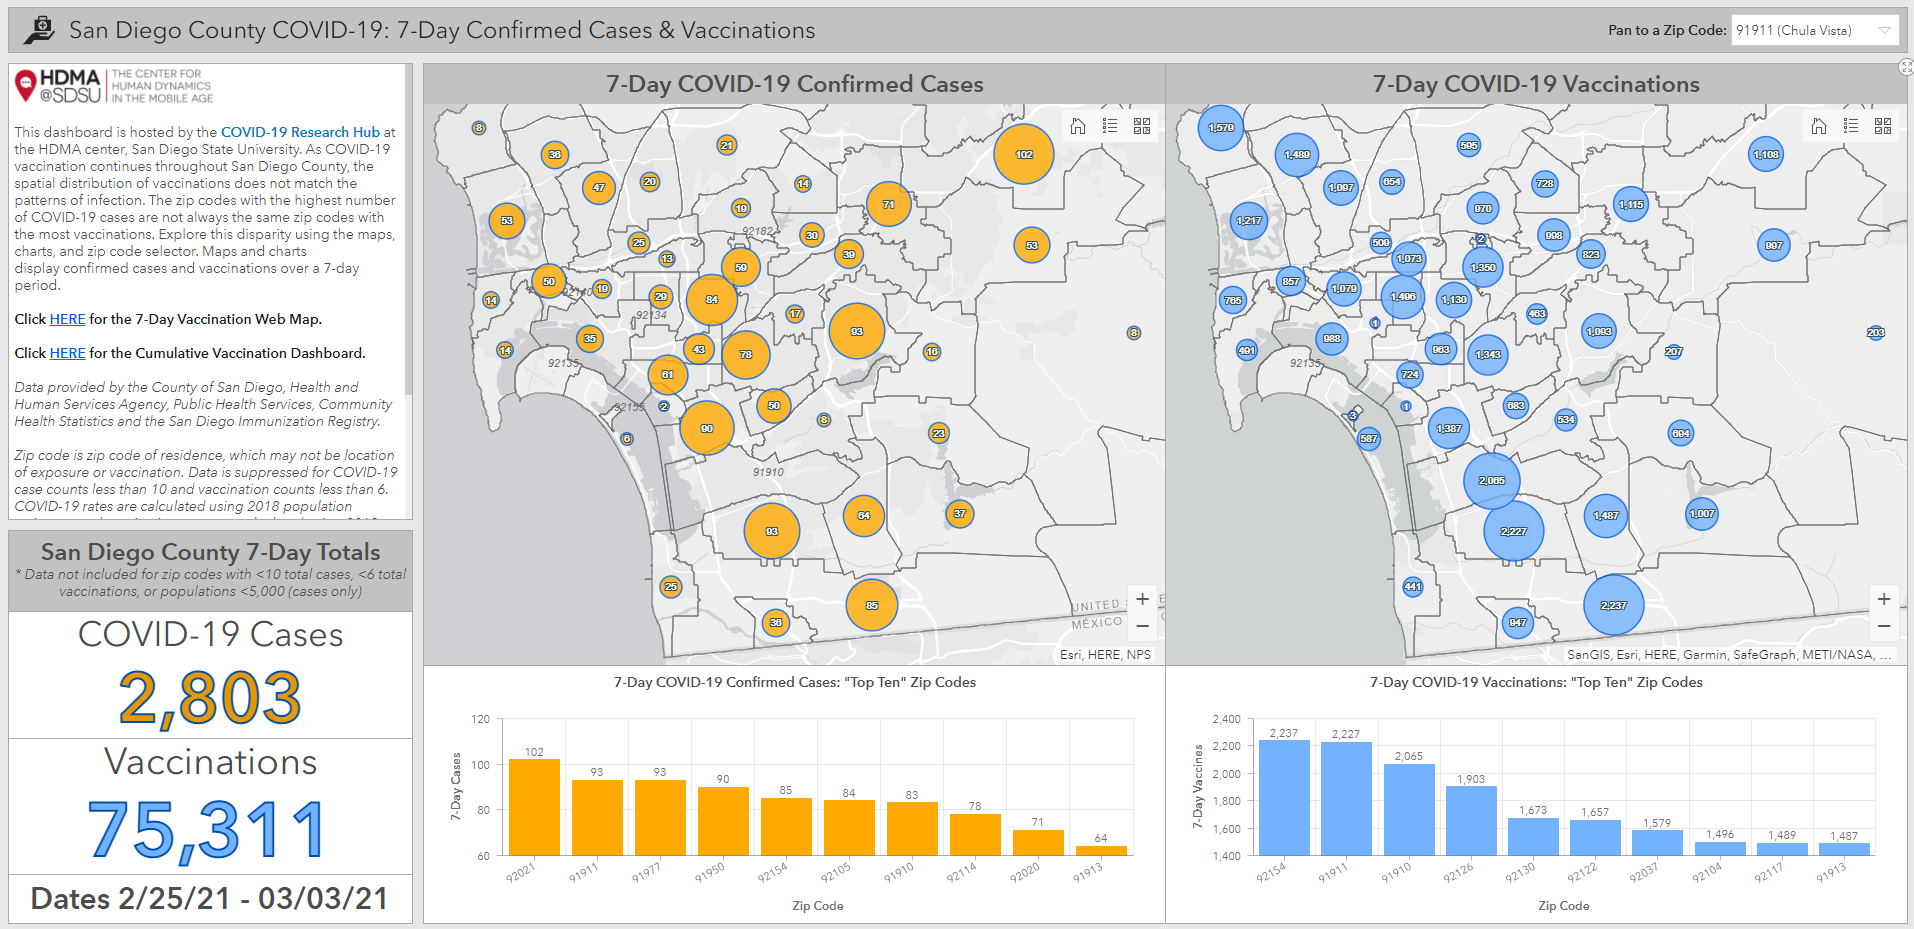
7-Day Change in COVID-19 Vaccinated Residents by San Diego County Zip Code
This dashboard created by the HDMA Center compares the change in COVID-19 vaccinated residents (1+ dose) by San Diego County zip code and confirmed COVID-19 cases over a 7-day period to explore disparities between vaccination and infection.
The Dashboard can be accessed here:
7-Day Vaccinated Residents & Confirmed Cases →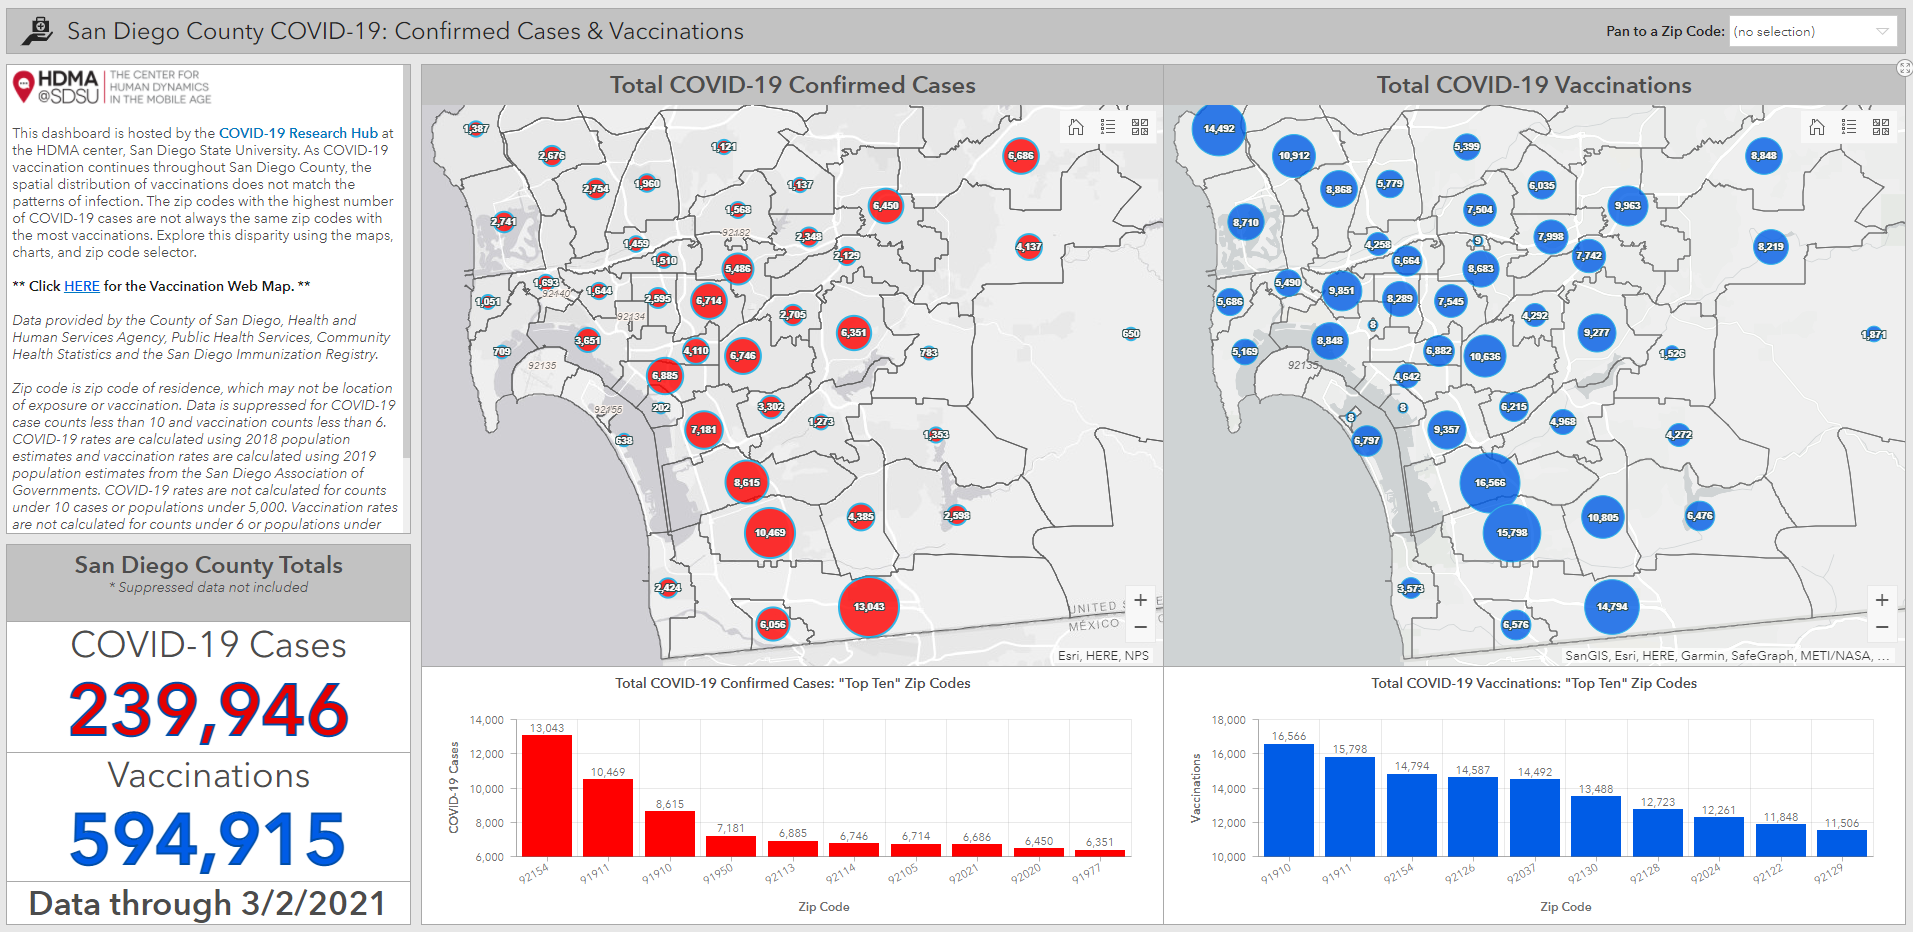
Total COVID-19 Vaccinated Residents by San Diego County Zip Code
This dashboard created by the HDMA Center compares the total number of COVID-19 vaccinated residents (1+ dose) by San Diego County zip code to the cumulative number of confirmed COVID-19 cases to explore disparities between vaccination and infection.
The Dashboard can be accessed here:
Total Vaccinated Residents & Confirmed Cases →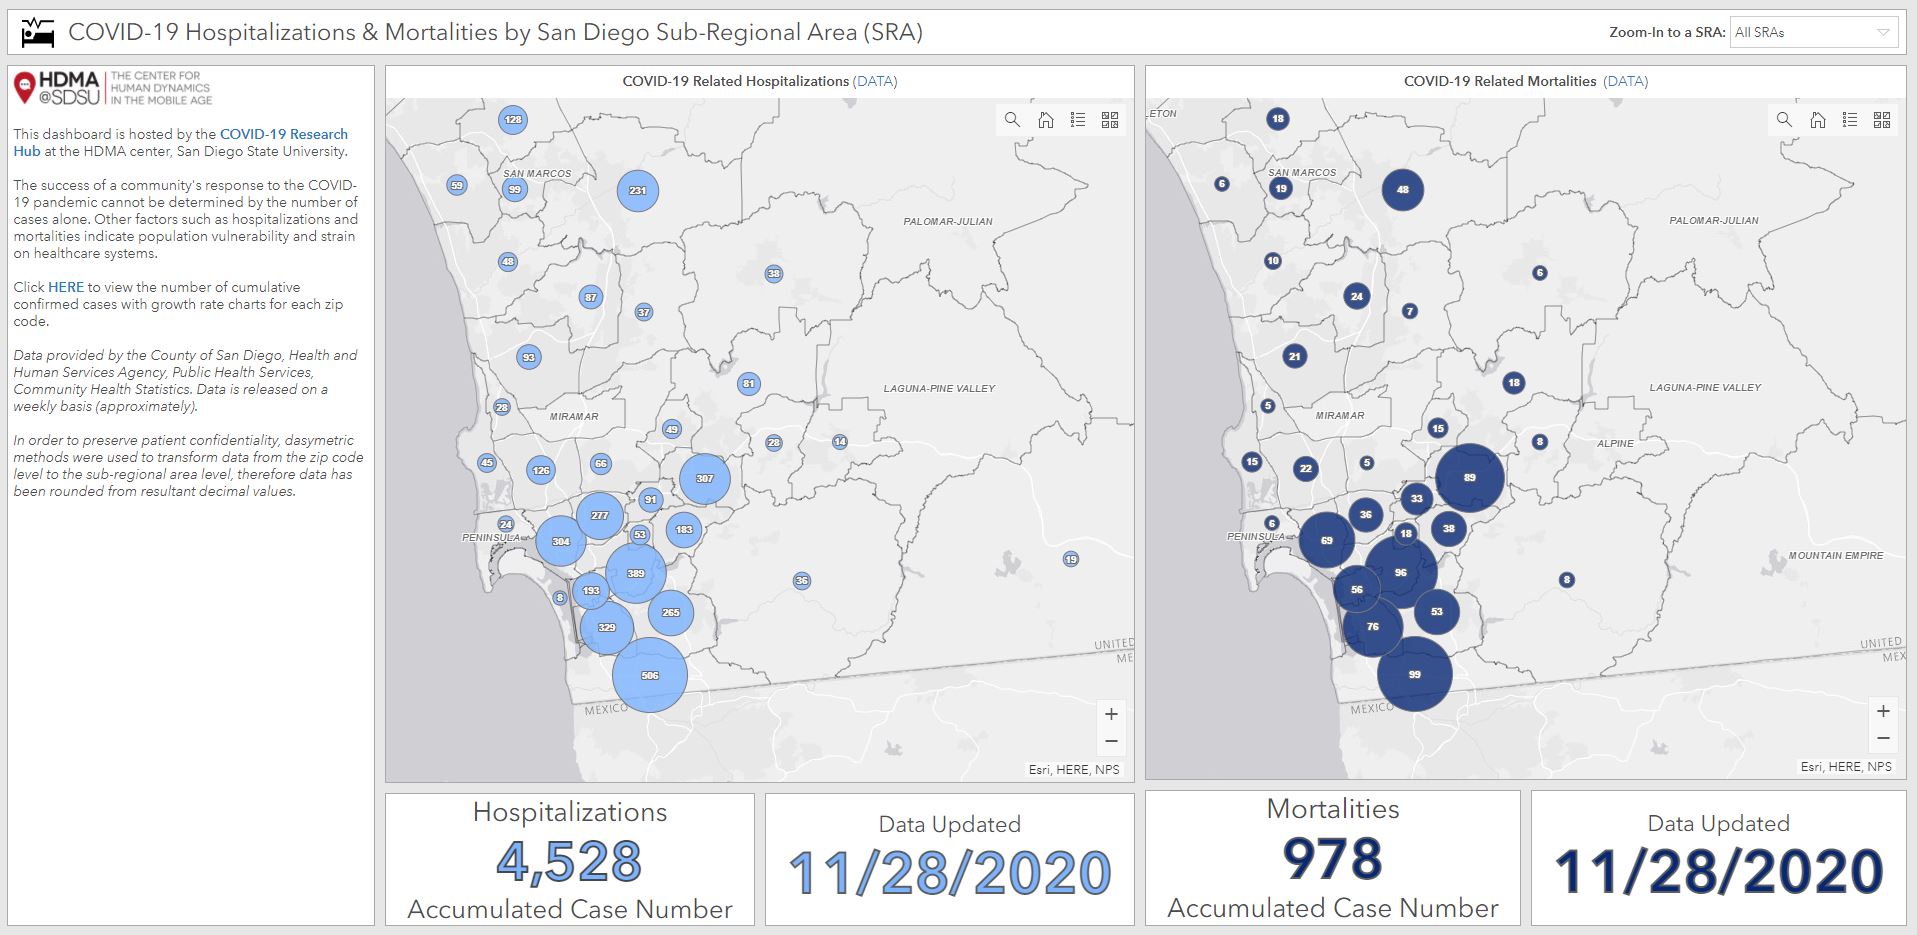
Accumulated San Diego COVID-19 Hospitalizations and Mortalities
Data last updated on December 26, 2020.
This dashboard created by the HDMA Center compares the accumulated COVID-19 related hospitalizations and mortalities by sub-regional area to assess community vulnerability and strain on healthcare systems.
The Dashboard can be accessed here:
Accumulated COVID-19 SRA Hospitalizations and Mortalities →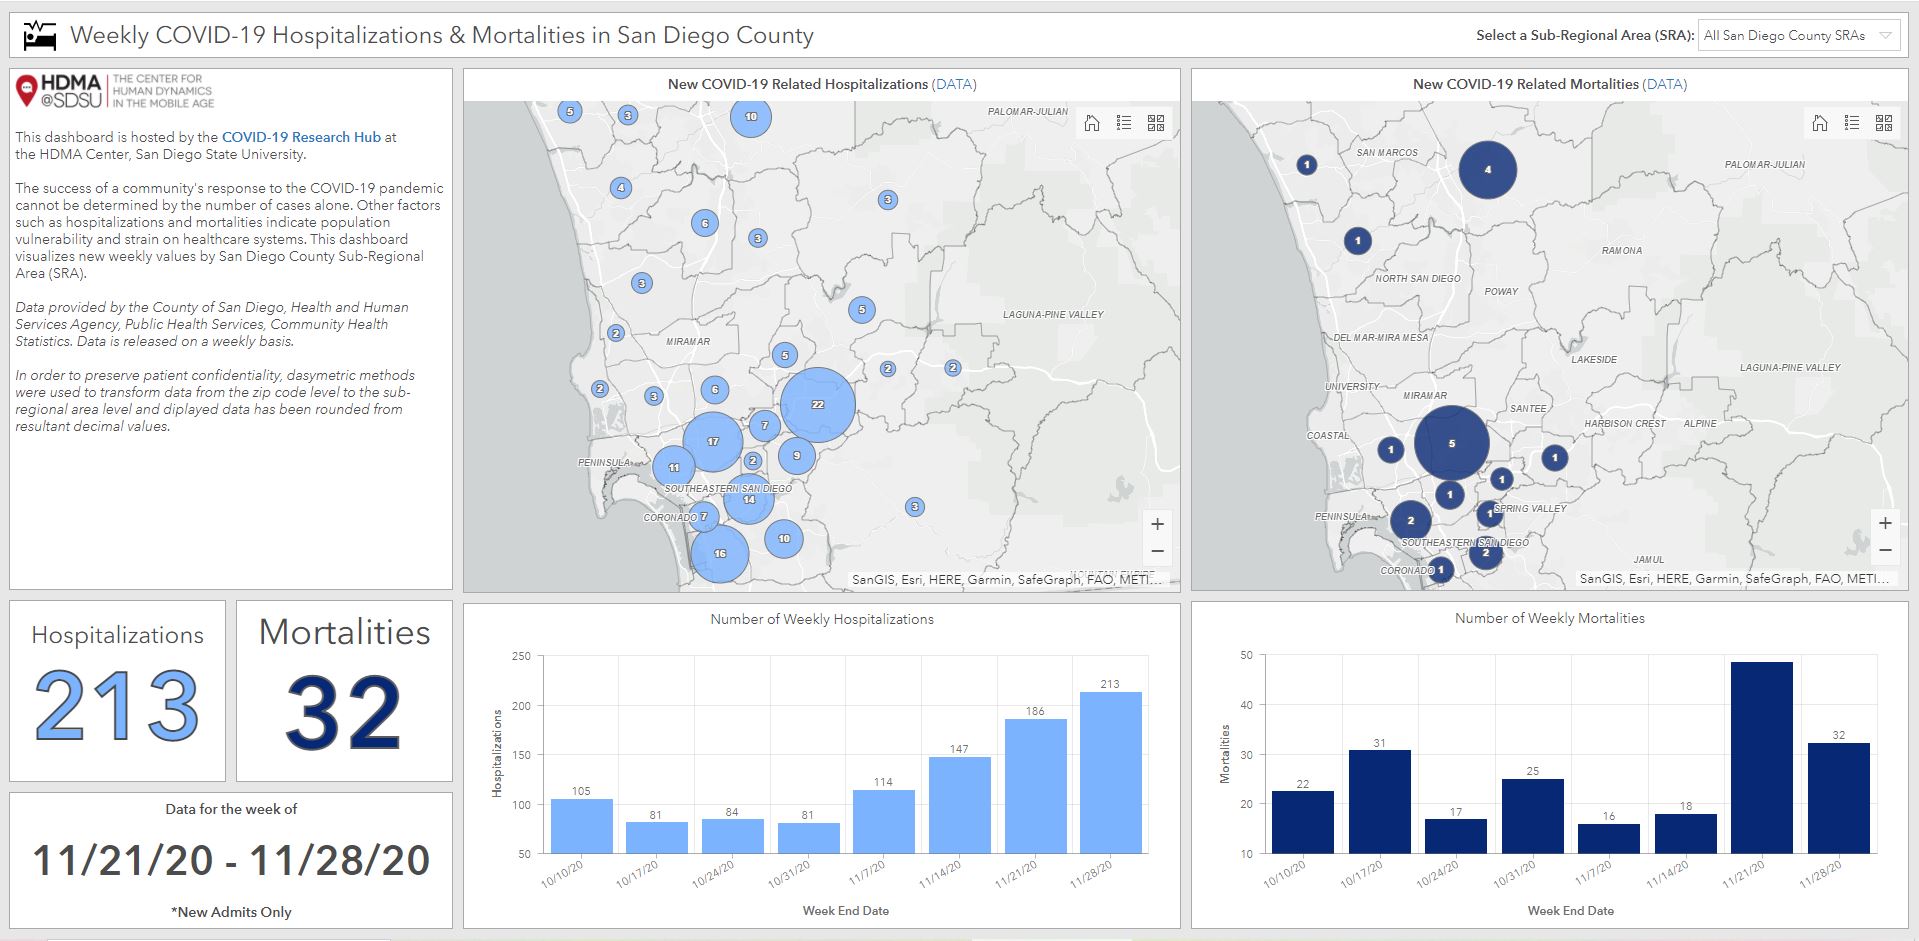
Weekly San Diego COVID-19 Hospitalizations and Mortalities
Data last updated on December 26, 2020.
This dashboard created by the HDMA Center compares the weekly COVID-19 related hospitalizations and mortalities by sub-regional area to assess community vulnerability and strain on healthcare systems.
The Dashboard can be accessed here:
Weekly COVID-19 SRA Hospitalizations and Mortalities →